

Feature scaling strategy - Mean, Median or Mode?


What is feature scaling
Take this list of numbers for example, what do you see here?
89,90,91,93,95
- The numbers are gradually increasing
- They're pretty close to each other
- Since they're pretty close to each other, their euclidian distance will be minimal
- A low euclidian distance would mean that your inference/classification algorithms (that use distance as a metric) can easily make decisions on this list of numbers.
But obviously, in real life, you neither run inference/classification on such a simple list of numbers, nor your data will be this gracefully ranged. You, dear padawan, have to range it yourself. In technical terms, you have to scale, or normalize your data within a certain range so that your algorithm doesn't have to go on a 10 hour Batman Seizure.
This process of scaling your data is known as feature scaling, also called normalization. But why do we care about Mean, Median or Mode while normalizing data?
The notion of central tendency
Central Tendency is what gives a birds-eye view of your data, also some insights into what you can expect from it. Mean, Median, Mode all are metrics of central tendency and it depends on how your data is spread over or ranged or distributed that which one these is going to give you better insight into your data.
Consider the previous list of numbers again. If we calculate the mean of these numbers, we get,
$$ mean = \frac{89 + 90 + 91 + 93 + 95}{5} = 91.6 $$
91.6 is pretty close to all the numbers in the list, so when you go onto make decision about this list you can say that the numbers are around 91.6 and so on. In this case, Mean does a pretty good job at telling you what to expect. Now how about this list of numbers?
3, 3, 3, 3, 100
$$ mean = \frac{3 + 3 + 3 + 3 + 100}{5} = 22.4 $$
22.4 is neither close to 3 or 100. Mean isn't helping us here. However, if we take the Median or Mode, which is 3, we get a pretty clear picture about this list of numbers. Also, based on the distribution, we can call 100 an outlier here (something that's out of pattern).
Effect of central tendency on feature scaling
When you normalize your data, your goal should be to centre your data as much as you can around the central tendency. Take a look at this illustration or a Normal / Gaussian Distribution
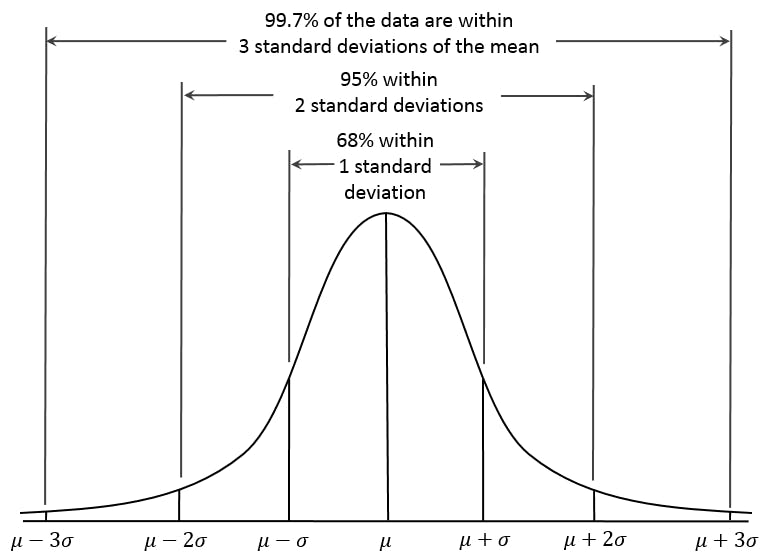
At the centre you have the mean and the distribution is spread at the range of 3 on both sides of the mean. Here the central tendency is the mean, and from the standard deviation you can measure how far from the mean the data is going to be. So, when you normalize your data, it should follow the same principle. Not all datasets will follow a normal distribution but you can convert them to follow normal distribution by applying a tiny bit of high school statistics.
So which one then
There's no definite answer. It all depends on the nature of your data (type of data, distribution among key things to consider). If you happen to have a lot of nominal or categorical data, then central tendency can't really help you because nominal data doesn't have any numerical significance.
For Ordinal data (frequency, degree etc.) you can opt for the mood in most cases, even median may work. In case you have ratio/interval scale data, either mean or median will work. Regardless it is always better to check how your data is distributed before picking a method to get central tendency.